
Technical Views: Clear Trading Plan
Technical Views delivers actionable trading setups. Discover new trade ideas and better timing for your market entry and exit points. Technical Views combines automated quant algos with the input of registered market analysts to give you clear market intel.
- Actionable trading plans
- Straight-to-the-point
- Frequent updates across the day
- Full instrument coverage
Signature Charts: Clear Point of View
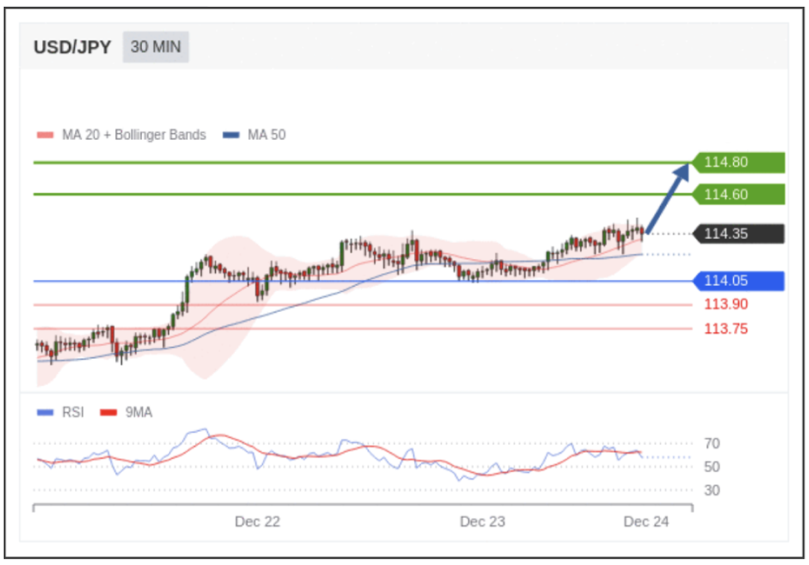
Technical Views has trend lines, patterns and indicators set out on each price chart. This gives you insight to the technical analysis approach used in the trading setup.
But centre your focus on the outcome. These 3 elements are the most important in your trading setup:
- Direction Arrow
- Targets
- Pivot Line
Sharp sense of direction
The blue arrow gives you instant clarity and sense of direction. It shows the projected course the market is likely to take. A blue arrow pointing higher on the chart shows prices may rise in the anticipated scenario. And a blue arrow pointing lower on the chart shows prices expected to fall.
Manage your Risk
Traders often use the Pivot Line to set their stop-loss orders. This helps protect their capital by closing a losing position.
A projected scenario stays in effect as long as the price does not reverse to cross the Pivot Line in the opposite direction. When prices cross the Pivot Line the opposing scenario triggers. In such cases, price action is expected to move in the opposite direction.
Targets help you take profits
Managing your risk is vital but exiting with profit is just as important! Every trading scenario has 2 distinct Target Levels. These are the planned exits to the trade, and traders often use them to set their take-profit levels. Targets for Bullish scenarios are green and the ones for Bearish scenarios are red. A classic strategy is to close half the position at the first target and lock some profits right in. And set a second take-profit order to fully exit the trade when the price hits the second target.
FAQs
Every trading setup offers two exit points. The first target is moderate while the second one is more ambitious. These Target Levels are clearly marked by the bold lines towards which the blue arrow is pointing at. Targets for Bullish scenarios are colored green while targets for Bearish scenarios are red. When the price hits one of the targets the trading scenario checks out.
These annotations provide info on why these levels were chosen and how likely they are to be reached. The number next to the asterisk indicates the strength of the probable outcome. An asterisk marked 1 shows low expectancy, 2 indicates medium, and 3 means high probability.
This is an important line. This is the Pivot Level in the trading setup. When the price crosses this level, the market has changed behavior and the expected scenario is no longer valid. Since the Pivot Level shows when the expected scenario becomes invalid, it can be used to set the stop-loss level and manage your risk.